Accessibility is the ability to make websites usable by everyone. When a website is not accessible, we are creating barriers and making their impairment a disability. We need to build websites and include accessibility testing in our STLC to cater to people with disabilities for both better business and usability.
Accessibility testing involves checking whether a website abides by WCAG guidelines and accessibility legislation and yields better SEO. It spans both open-source utilities and enterprise-grade platforms.
Open-source tools like Lighthouse, WAVE, Pa11y, and axeTools are widely adopted for their simplicity and community support.
At the same time, platforms like BrowserStack extend coverage with features such as real-device testing, AI-driven detection, and compliance with global regulations.
Let’s explore some widely used accessibility audit tools.
BrowserStack
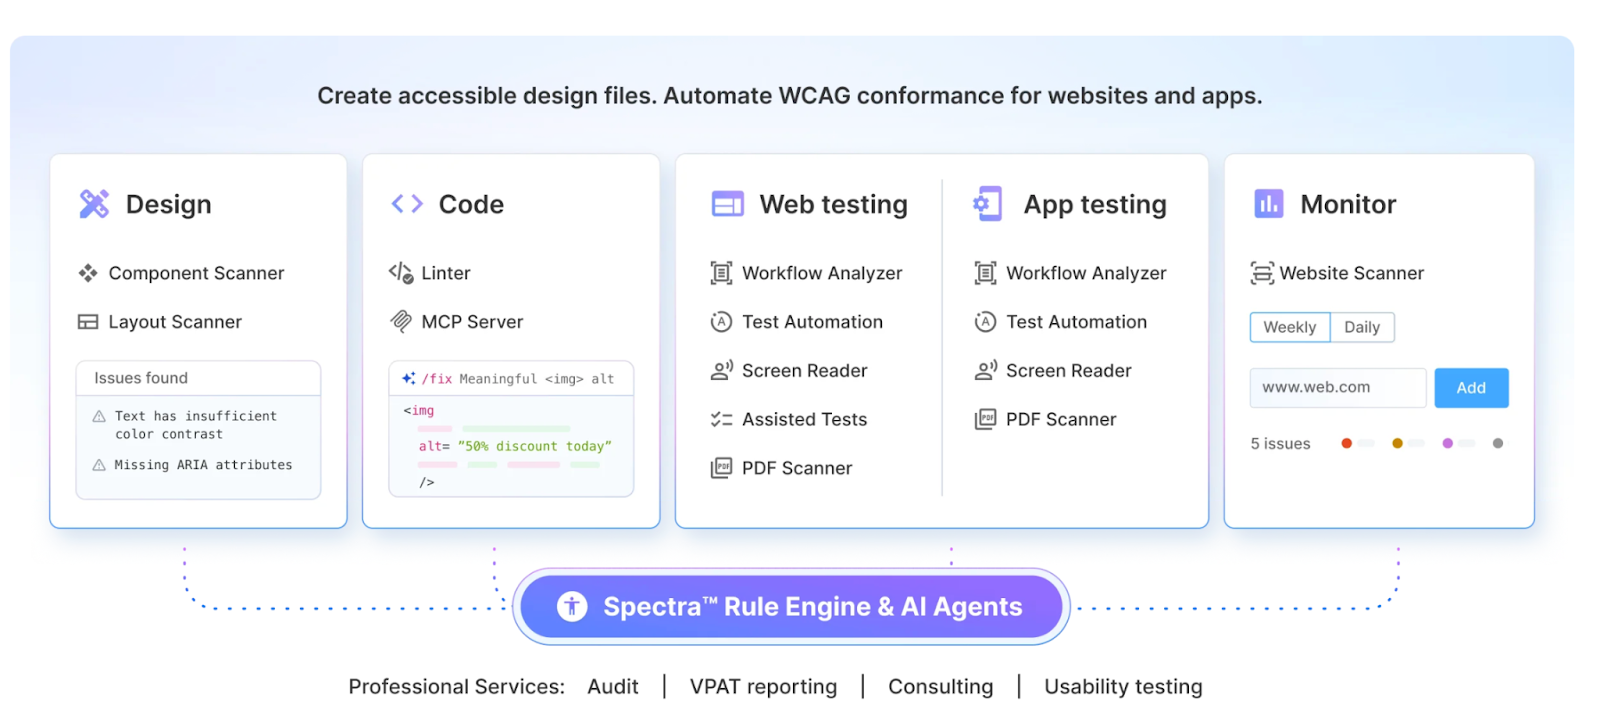
BrowserStack provides a unified, powerful platform for web and mobile app accessibility testing. It integrates manual, automated, and extension-based workflows to help teams ensure compliance with WCAG standards across real devices, browsers, and environments. While not open source, it offers reliable free plans and enterprise-grade capabilities.
BrowserStack Accessibility Testing (Web)
Though an enterprise-grade tool, BrowserStack Accessibility Testing is built to cater to teams of all sizes to help deliver inclusive digital experiences effectively. It ensures adherence to 10+ global regulations, including WCAG, ADA, EAA, and Section 508. The tool offers automated scans, manual testing capabilities, a real device cloud, and seamless integration into development workflows.
Key features
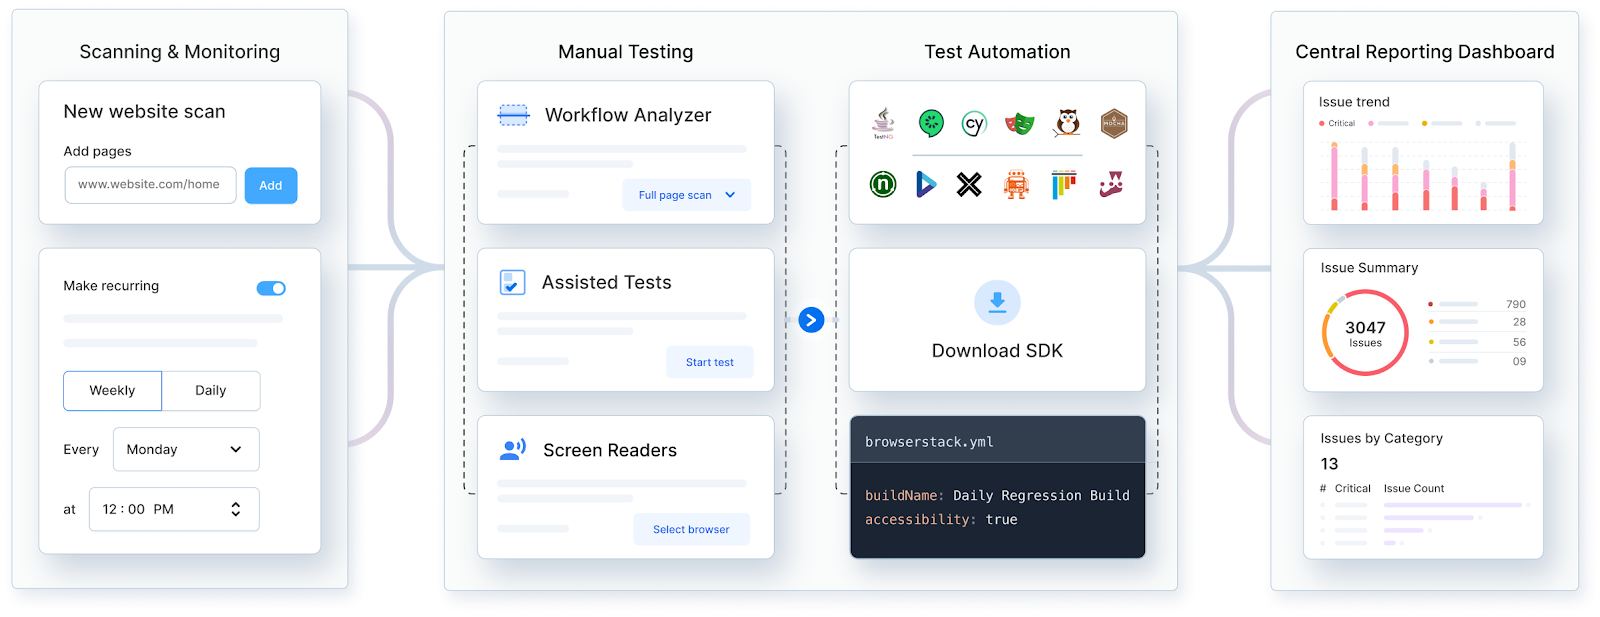
- Workflow Analyser: Automated detection of common issues like missing alt text, poor contrast, and ARIA misuse, along with scanning through user flows in a single run.
- Assisted Tests: Semi-automated tests that flag complex issues and guide testers through clarifying questions to validate accessibility manually.
- Screen Reader Testing: Manual usability testing using real devices with NVDA (Windows), VoiceOver (macOS), and TalkBack (Android).
- Website Scanner: Scheduled scans to continuously monitor accessibility health and catch new issues proactively.
- Automated Testing: Seamless integration via the BrowserStack SDK, including Spectra™ Rule Engine for embedding WCAG checks into CI/CD pipelines.
- AI Agents: AI Agents for issue detection leverage AI-powered, context-aware intelligence to automatically surface complex WCAG accessibility issues.
BrowserStack mobile app accessibility testing
Beyond websites, BrowserStack also extends accessibility testing to mobile apps. BrowserStack Mobile App Accessibility Testing streamlines accessibility standard assessments on real iOS and Android devices.
Driven by the Spectra™ Rule Engine, it delivers automated, AI-driven detection of 20+ key WCAG success criteria and ensures maximised coverage and accuracy.
Key features
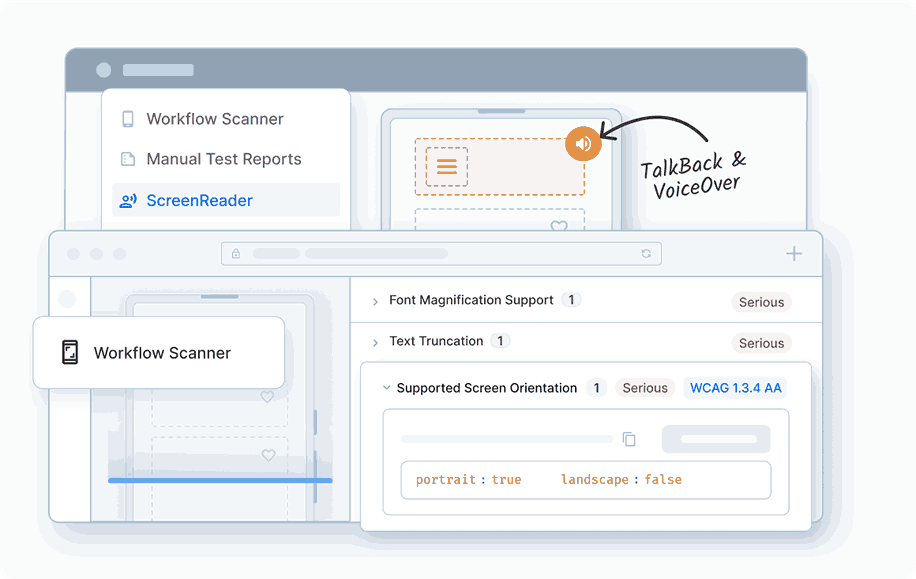
- App Workflow Scanner: Detects violations such as missing labels, inadequate touch targets, or contrast issues across app navigation flows.
- Spectra™ Rule Engine: Offers comprehensive, automated coverage of WCAG criteria; deduplicating and grouping issues with AI-powered guidance.
- Screen Reader Support: Test on real devices using VoiceOver (iOS) and TalkBack (Android) for authentic accessibility validation.
- Plug-and-Play Automation: Integrate with CI/CD effortlessly using the BrowserStack SDK to get detailed, severity-rated, and WCAG-tagged reports.
To use App Accessibility Testing, you can sign up for a free account on BrowserStack.
BrowserStack accessibility toolkit extension
For developers, BrowserStack’s Accessibility Toolkit is available as a browser extension. It integrates directly into Chrome DevTools for fast, in-context testing.
Key features
- Accessed via the Accessibility Toolkit tab in DevTools.
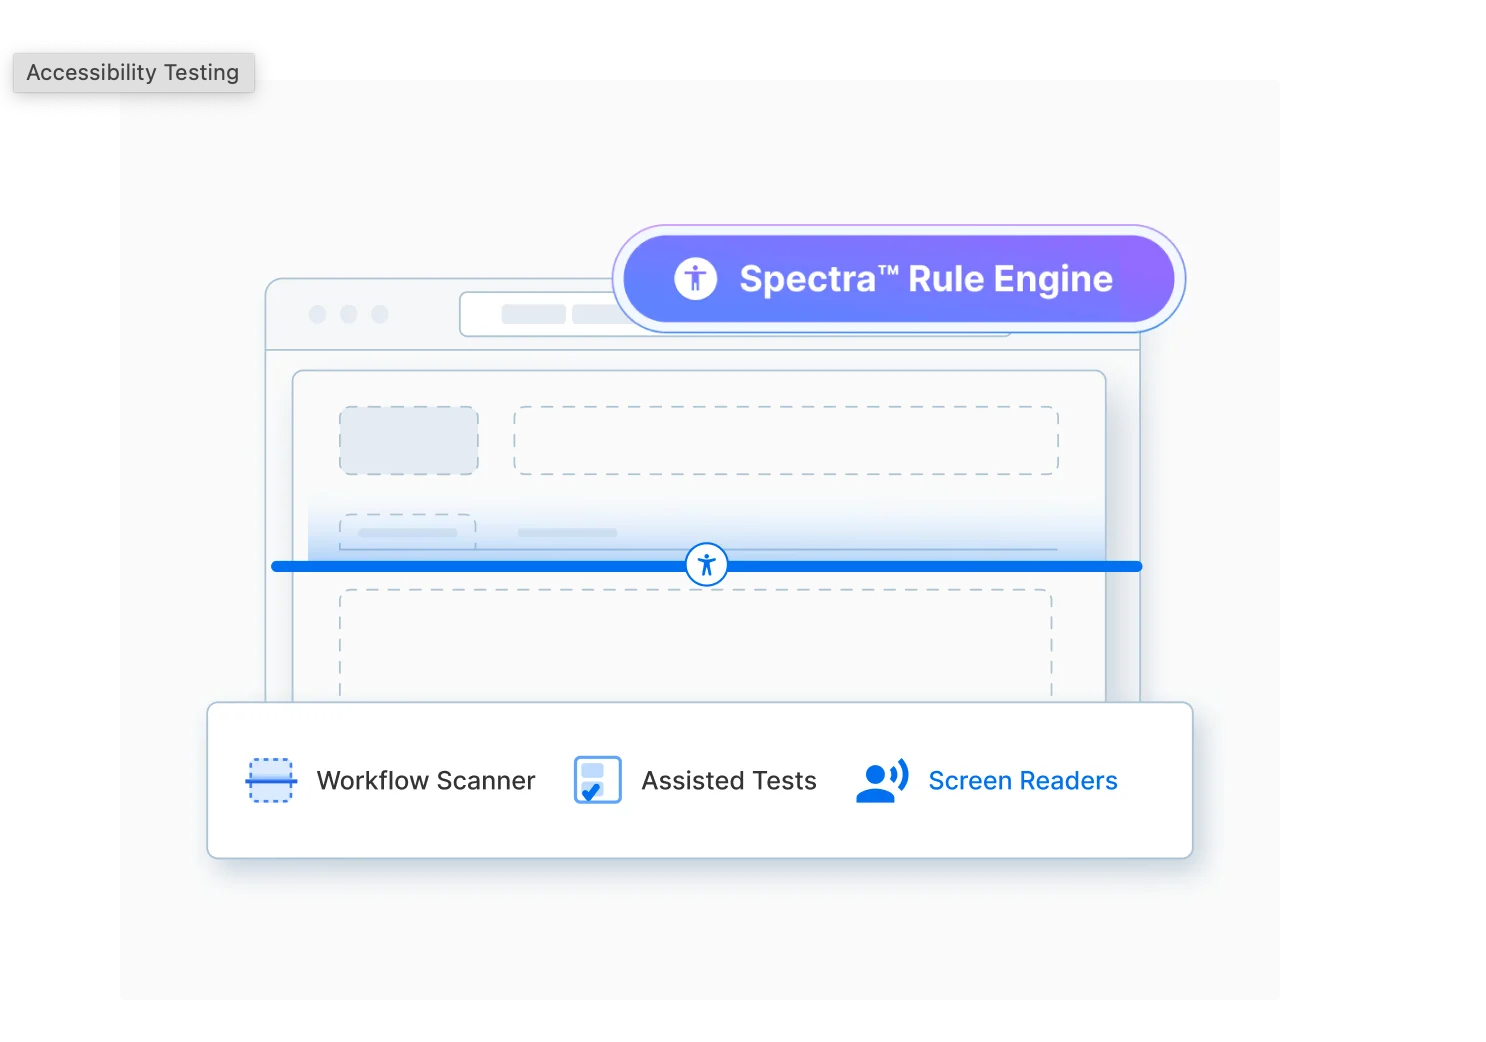
- Offers all core testing modes like Website Scanner, Workflow Analyser, Assisted Tests, and Automated Tests directly within the browser.
- Enables scheduling of scans, manual testing walkthroughs, and integration into automated suites using BrowserStack SDK.
- Results display instantly in the DevTools panel, including flagged issues, severity levels, and WCAG mappings.
How to use the extension
- Add the extension from the Chrome Web Store.
- Open Chrome DevTools.
- Navigate to the Accessibility Toolkit tab within DevTools.
- Run a scan by choosing from modes like Workflow Analyser, Website Scanner, Assisted Tests, or Automated Tests.
- View results instantly in the DevTools panel, including flagged issues, severity levels, and WCAG mappings.
- Re-run or close the extension by switching tabs in DevTools or refreshing the page.
Lighthouse
Lighthouse is an open-source, automated tool that can audit web pages regarding performance or accessibility issues.
Lighthouse audit report consists of accessibility score, rules that elements fail to meet, passed audits, ‘additional items to manually check’ and ‘not applicable audit for the web page’. Audit scoring is done based on the categories mentioned below and a report is generated:
- Navigation
- ARIA
- Names and Labels
- Contrast
- Tables and list
- Best Practices
- Audio and video
- Internationalization and localization
- Additional items to manually check
Lighthouse is available in three workflows:
- Chrome DevTools
- Command Line (Node CLI)
- Chrome/Firefox Extension
A] Chrome DevTools
Lighthouse is built-in the Chrome browser, with no setup or extensions to install, and can be used to test both local sites and authenticated pages. Here’s how you can audit URLs accessibility via Lighthouse Chrome DevTools:
- Launch the URL you want to audit in Google Chrome
- Open the Chrome DevTools (Shortcut - Command+Option+C (Mac), Control+Shift+C (Windows, Linux, Chrome OS))
- Click on the Lighthouse panel
- DevTools shows a list of audit categories
- Select ‘Desktop’, ‘Accessibility’, ‘No throttling’ and ‘Clear storage’ options
- Click ‘Run audits’
- Google Lighthouse gives your page a score out of 100
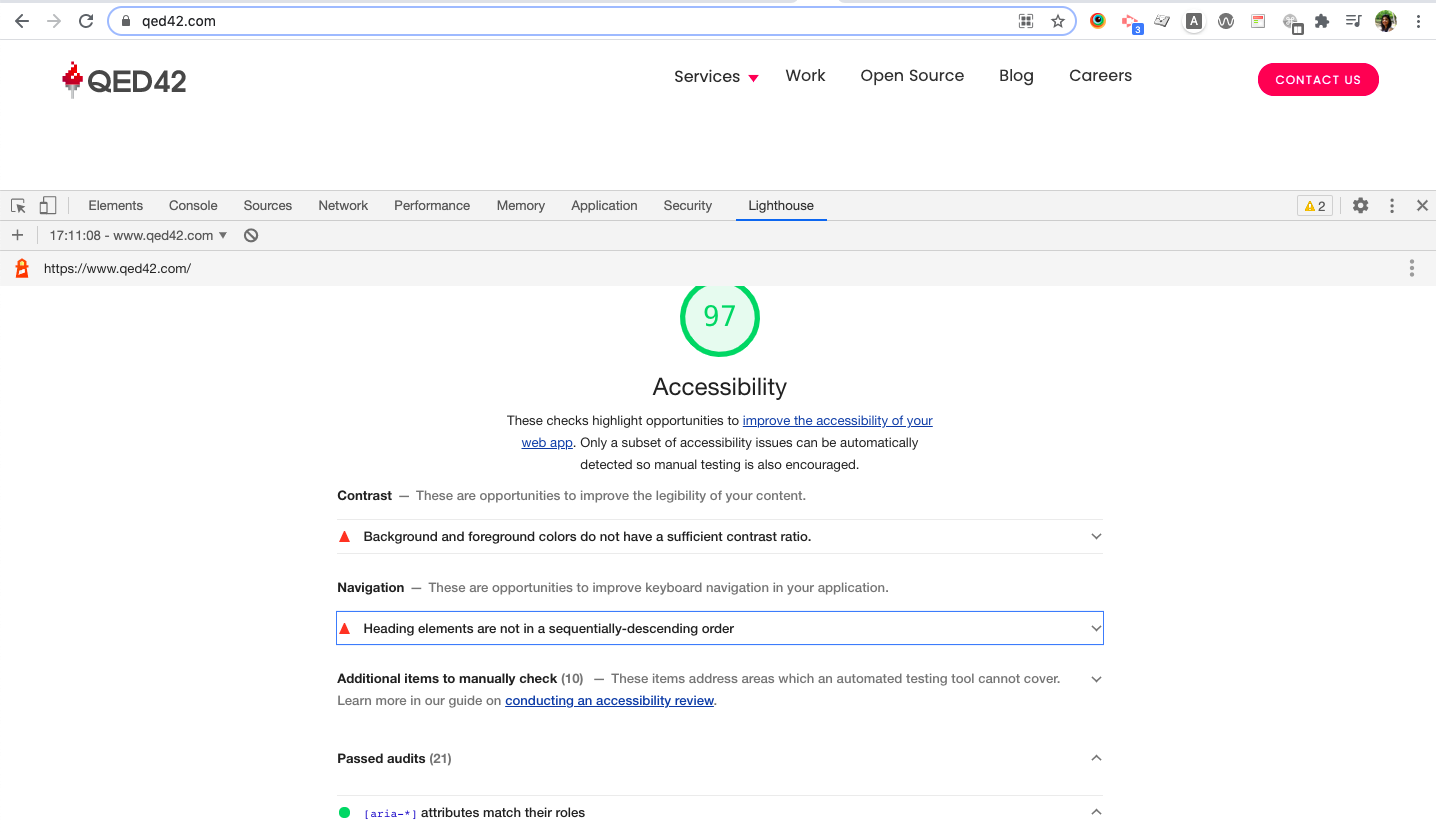
Attached to each section of the report is a documentation/link explaining why that part of your page was audited and how to fix it.

B] Command Line (Node CLI)
Lighthouse can be configured and reported for advance usage via Node CLI. Follow the below-mentioned steps:
1. Download Node here. If you have it installed already, skip this step
2. Install Lighthouse
3. Run your audit
4. By default, Lighthouse generates the report in an HTML format. The report can also be displayed in JSON format by passing flags.
C] Chrome Extension
- Install the Lighthouse Chrome Extension from the Chrome Webstore
- Navigate to the page you want to audit
- Click Lighthouse Icon, next to the Chrome address bar
- Click Generate report.
Note: “The DevTools workflow is the best as it provides the same benefits as the extension workflow, with the added bonus of no installation needed.”
WAVE
The WAVE tool is a web accessibility evaluation tool, which helps analyze a website for accessibility and compliance with Web Content Accessibility Guidelines (WCAG) standard. WAVE is hosted by webaim.org, and is available as a ‘Website’ and as an ‘extension for Chrome/Firefox browsers’.
A] The WAVE website
- Visit http://wave.webaim.org and enter the webpage URL in the address field and hit “Enter”
- WAVE displays a version of the web page, highlighting essential accessibility information using inline icons
- The WAVE report will be generated with a summary on the left-hand side of the navigation
B] WAVE Browser Extensions
The WAVE Chrome and Firefox extensions allow you to evaluate web content for accessibility issues directly within Chrome and Firefox browsers. The extension checks intranet, password-protected, dynamically generated, or sensitive web pages. It can also evaluate locally displayed styles and dynamically-generated content from scripts or AJAX. Follow these simple steps:
- Add WAVE extension to Chrome/Firefox browser
- Click on the WAVE icon to the right of the browser address bar. (You can also trigger a WAVE report by pressing Control + Shift + U / Command + Shift + U on Mac)
- The WAVE extension will generate an audit report displaying the summary on the left-hand side of the navigation
- Click the icon again or refresh the page to remove the WAVE interface
What does a WAVE Audit Report include?
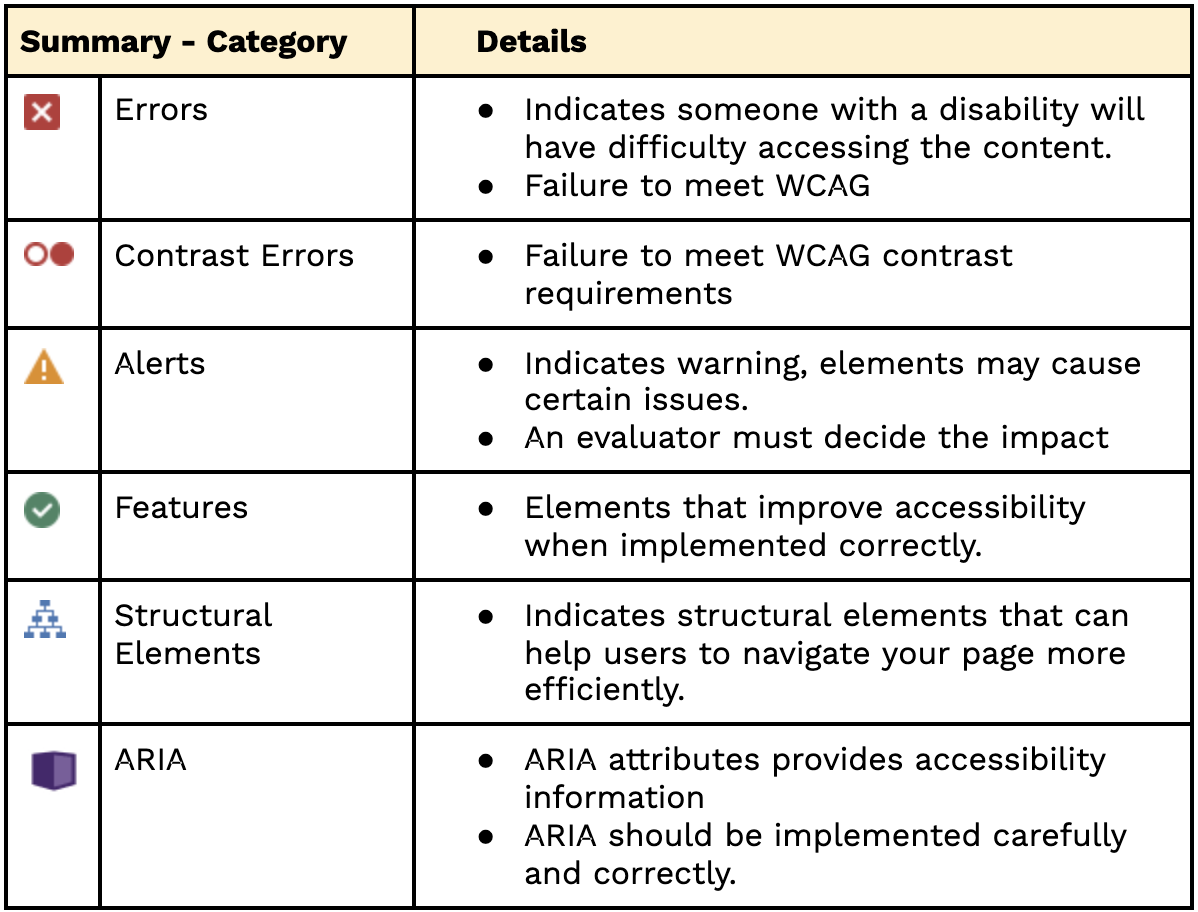
- Summary - This tab displays the findings of evaluation in six categories - Errors, Contrast Errors, Alerts, Features, Structural Elements and ARIA.
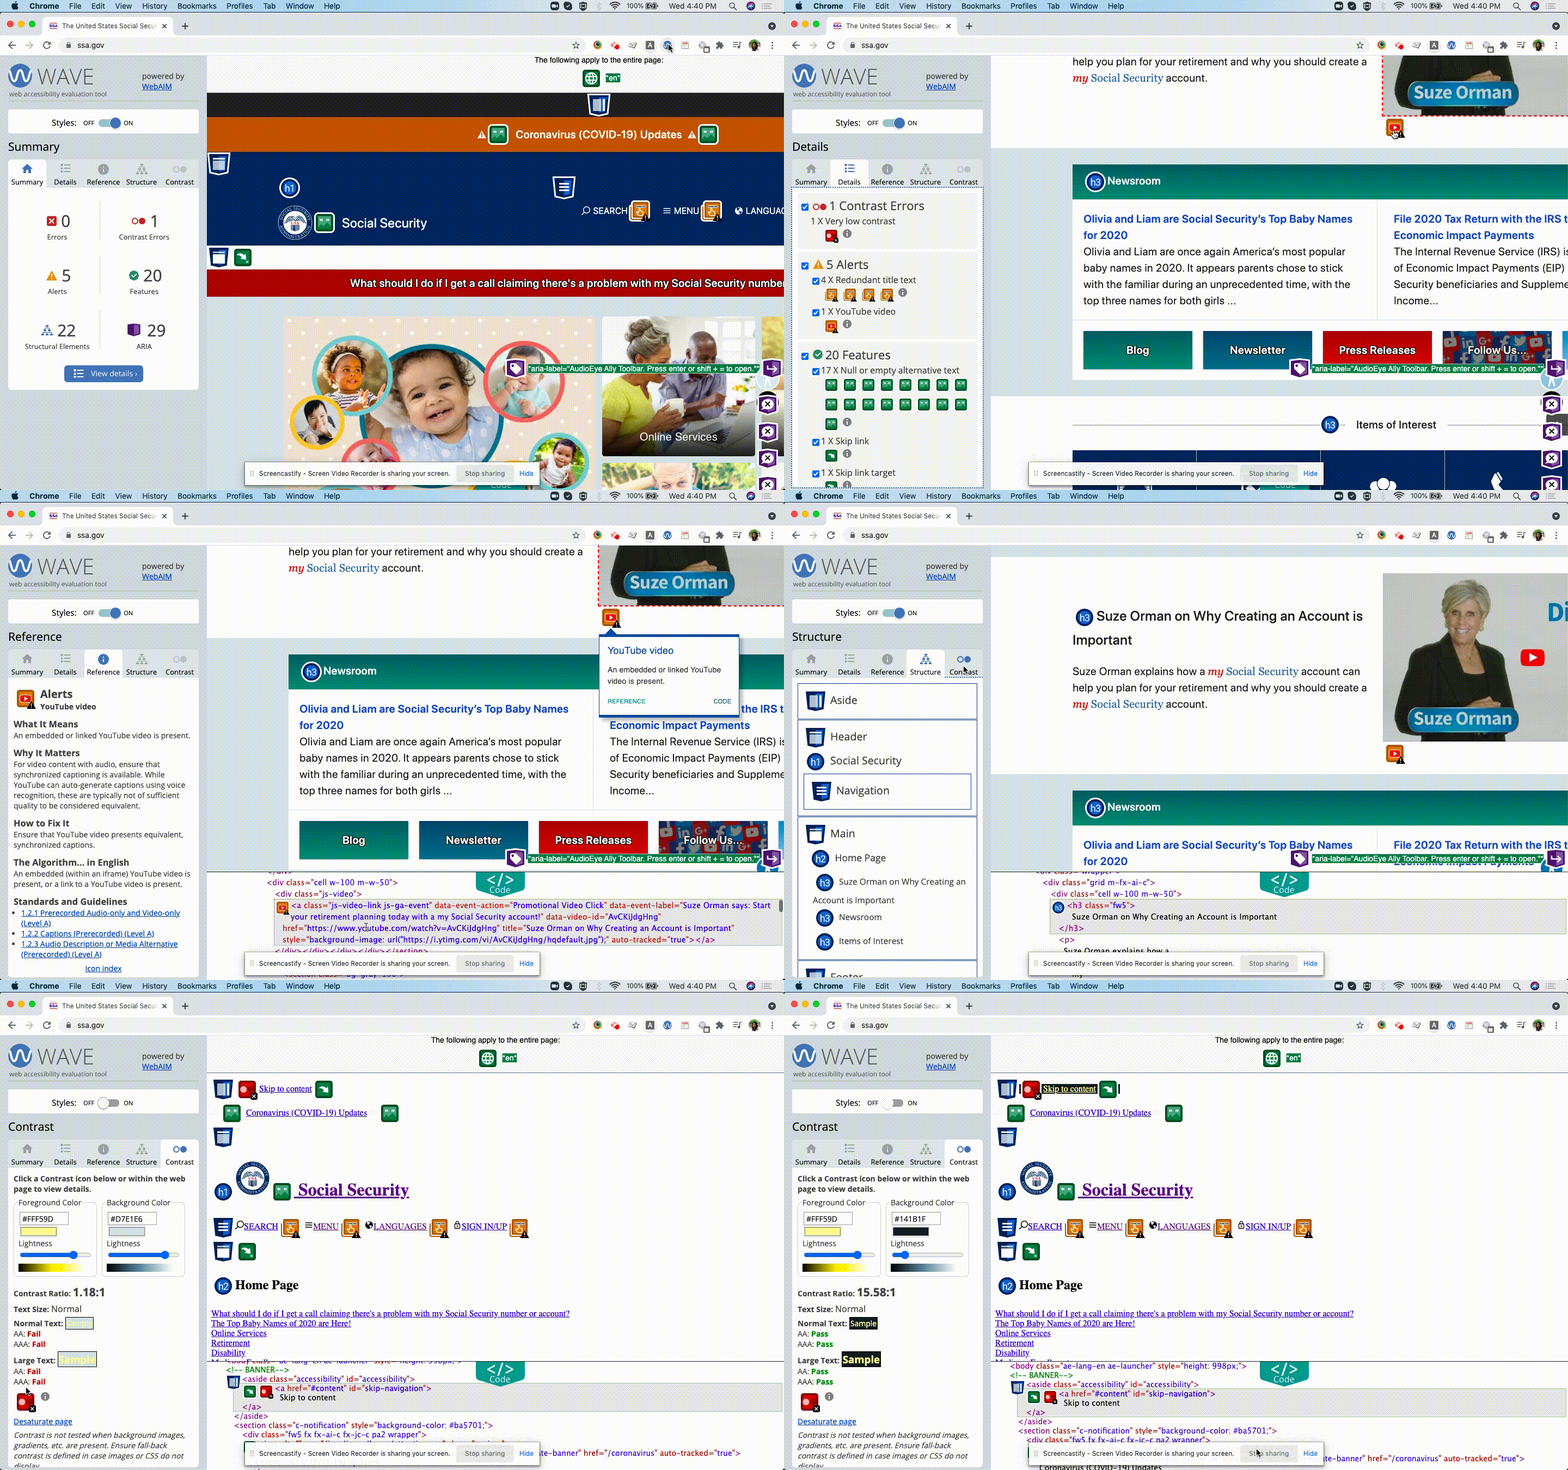
- Details - This tab shows the breakdown of every icon displayed on the page, grouped by category. Clicking on the icon under the details tab will highlight the issue on the page. You can click this highlighted icon on the page to open the tooltip with the issue description, ‘Reference’ and ‘Code’ panel links. In case an icon does not appear within the page, turn off the “Styles” switch to view it.
- References - This tab explains the issue, how an issue will impact users with disabilities, what can be done to fix it, the algorithm used to detect it and links to relevant WCAG requirements. There is also an icon index link that displays all of the WAVE’s icons grouped by category.
- Structural Elements - It displays regions of the page that have been identified with HTML or ARIA. It also displays the heading structure for the page. WAVE identifies hidden page elements, lists the regions and heading and indicates nesting of page elements.
- Contrast panel - It identifies text that does not meet WCAG Level AA contrast ratio requirement of at least 4.5:1. WAVE also provides information for the lower 3:1 contrast ratio requirement for large text.
- Code panel - This panel appears at the bottom of the window. The place in the code where the issue appears is highlighted and marked with an icon. Reviewing the code reveals the cause of the issue and helps in fixing it.
PA11Y
Pa11y is an open-source project that helps designers and developers make their web pages more accessible. There is a range of Pa11y free and open-source tools available.
A] Pa11y
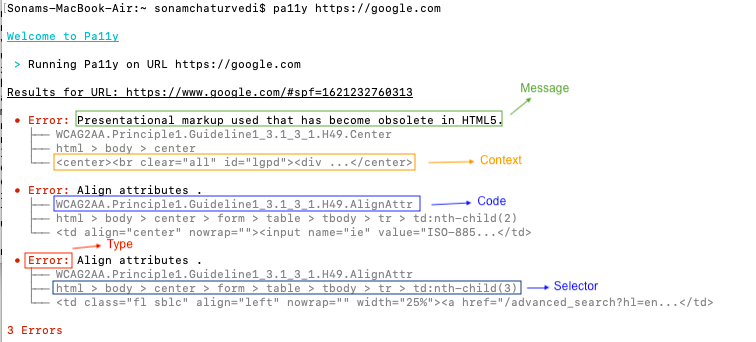
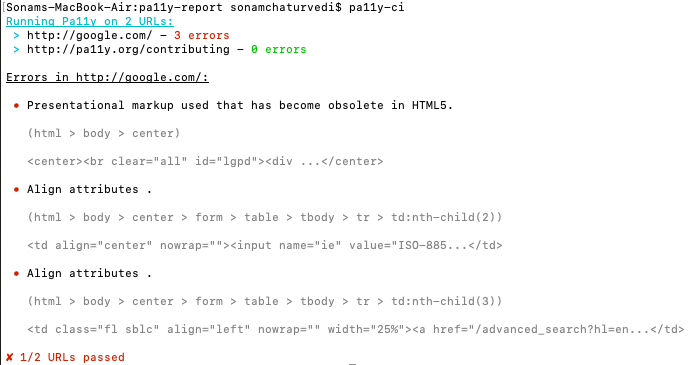
Pa11y is a command-line interface that loads web pages and highlights any accessibility issues it finds. It is useful when you want to run a one-off test against a web page. The Pa11y test result consists of Type, Message, Code, Context and Selector fields.

B] Pa11y CI
Pa11y CI can be used to run accessibility tests against multiple URLs or viewports and highlight the issues. You simply need to add the web page URLs in the .pa11yci JSON file (a config file in the current working directory).

C] Pa11y Dashboard
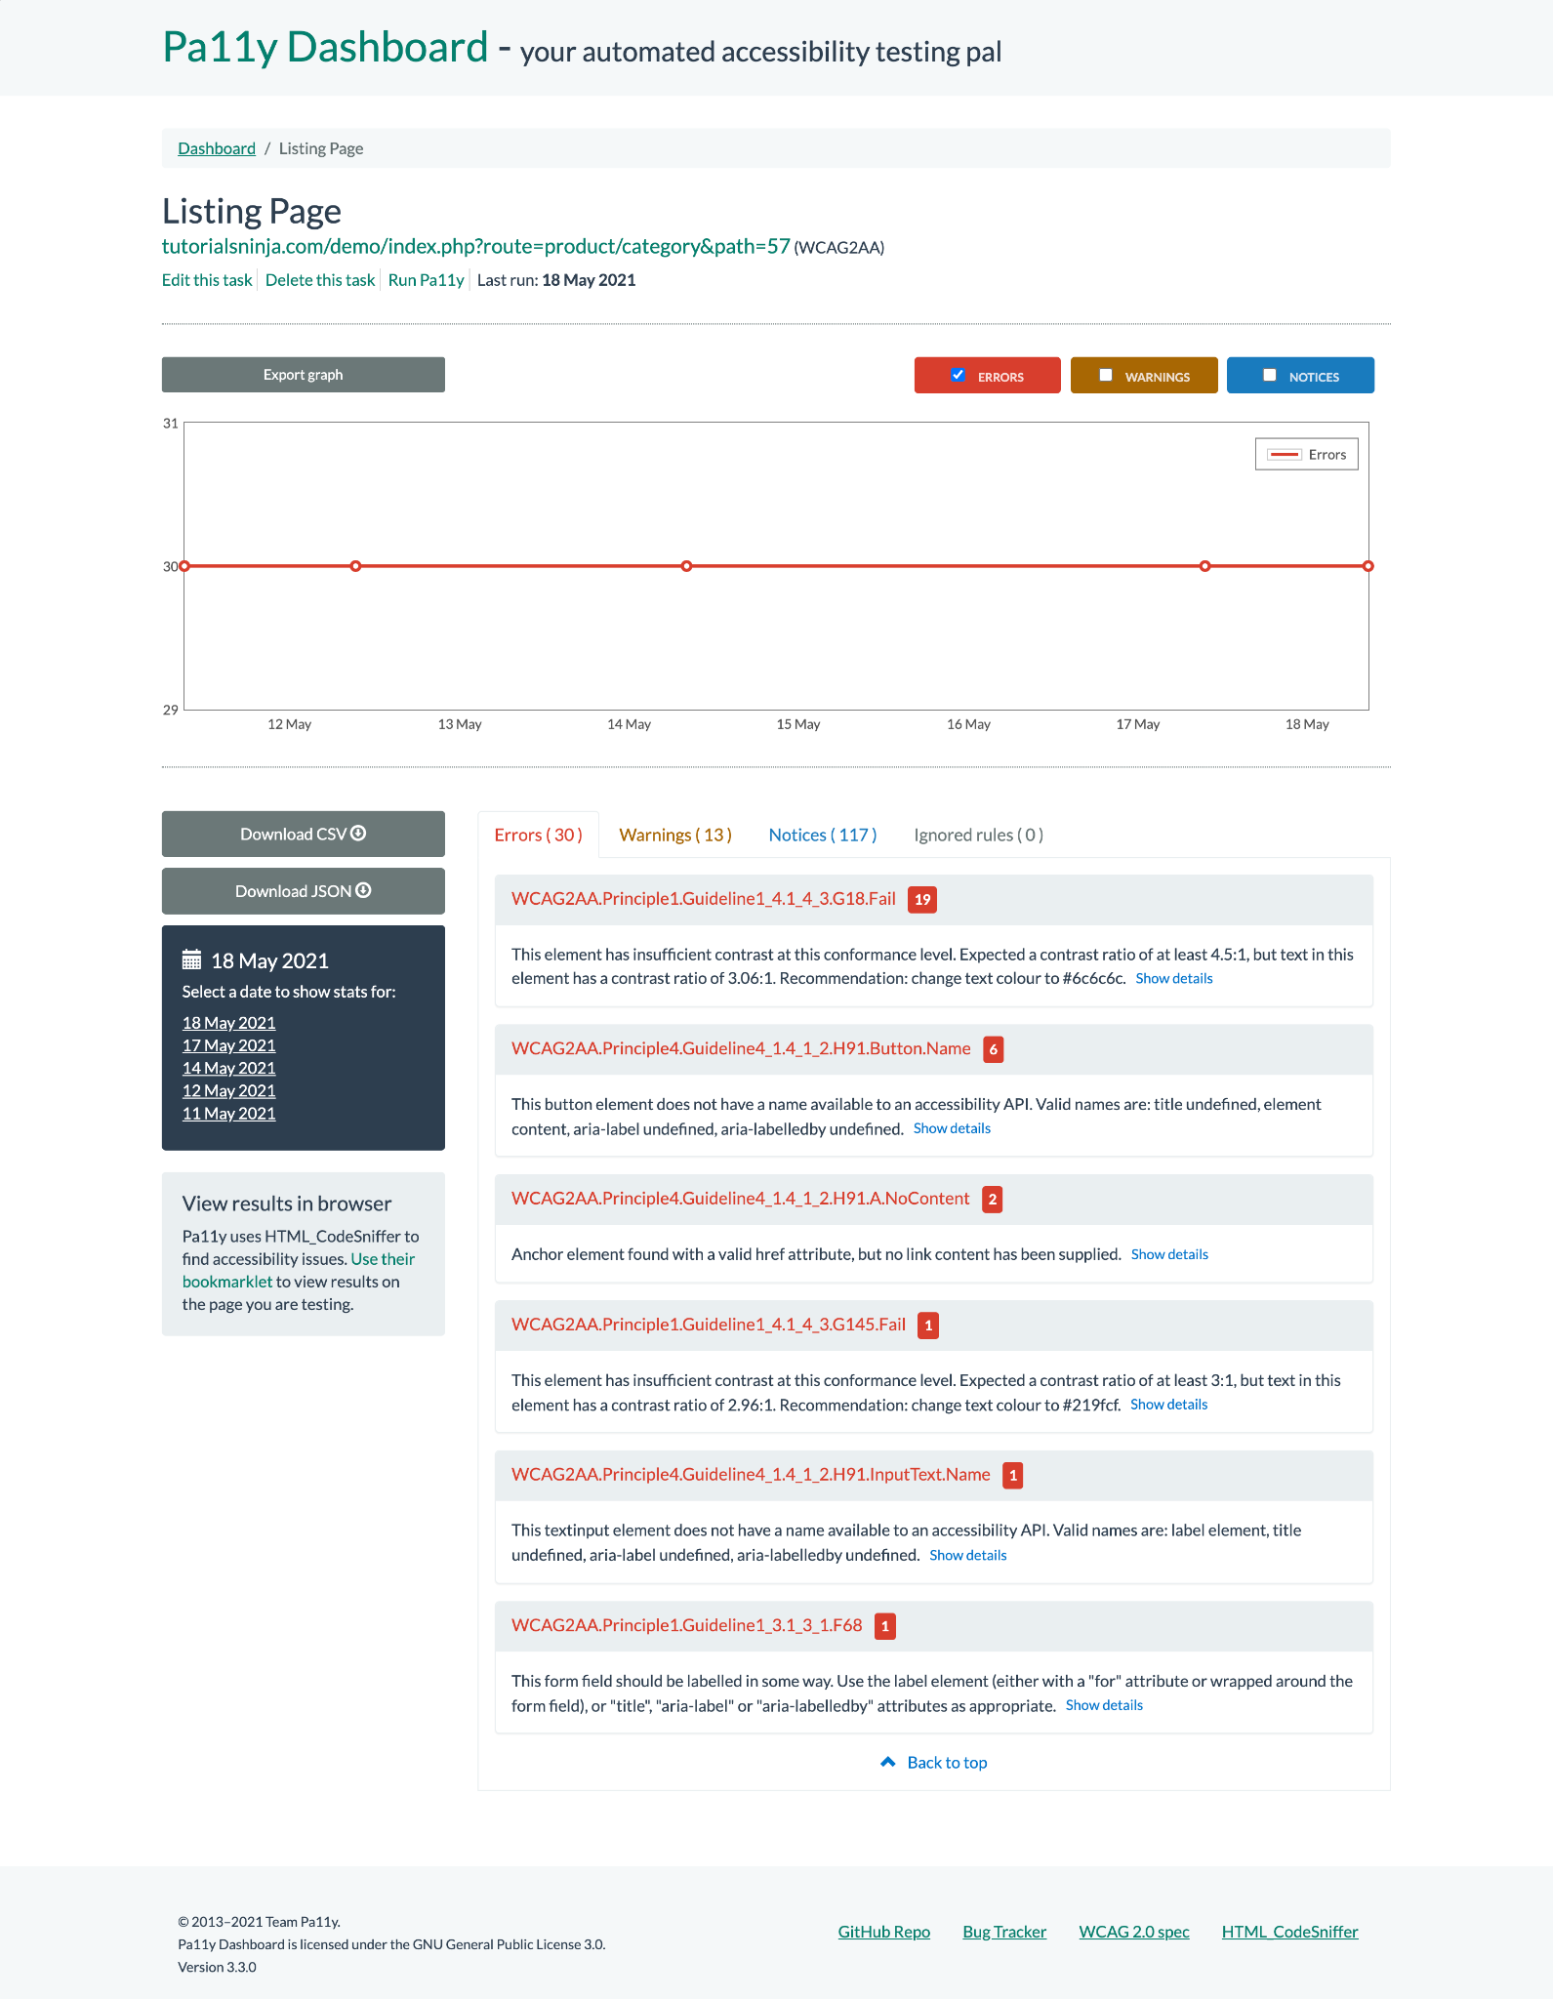
Pa11y Dashboard is an open-source web interface that helps keep a track of automated accessibility tests over time. It allows users to view, manage audit tasks, trigger audits and generate reports. Follow these steps:
- Create a task by clicking on “Add new URL”
- Enter details of the test URL and save it
- You will be taken to the task page having links: “Edit this task”, “Delete this task” and “Run Pa11y”
- Click “Run Pa11y” and generate the report
- Pa11y dashboard will display the output in three categories - Error, Warnings and Notices. There is a short description of each issue along with its location in the HTML
- You can export reports in CSV and JSON format
- The dashboard also displays a graph that illustrates the delta in errors, warnings, and notices over time
- By default, automated audits are performed daily and can track each audit.
Note: Refer to our Pa11y blog for installation and configuration steps
axeTools
A] axe DevTools
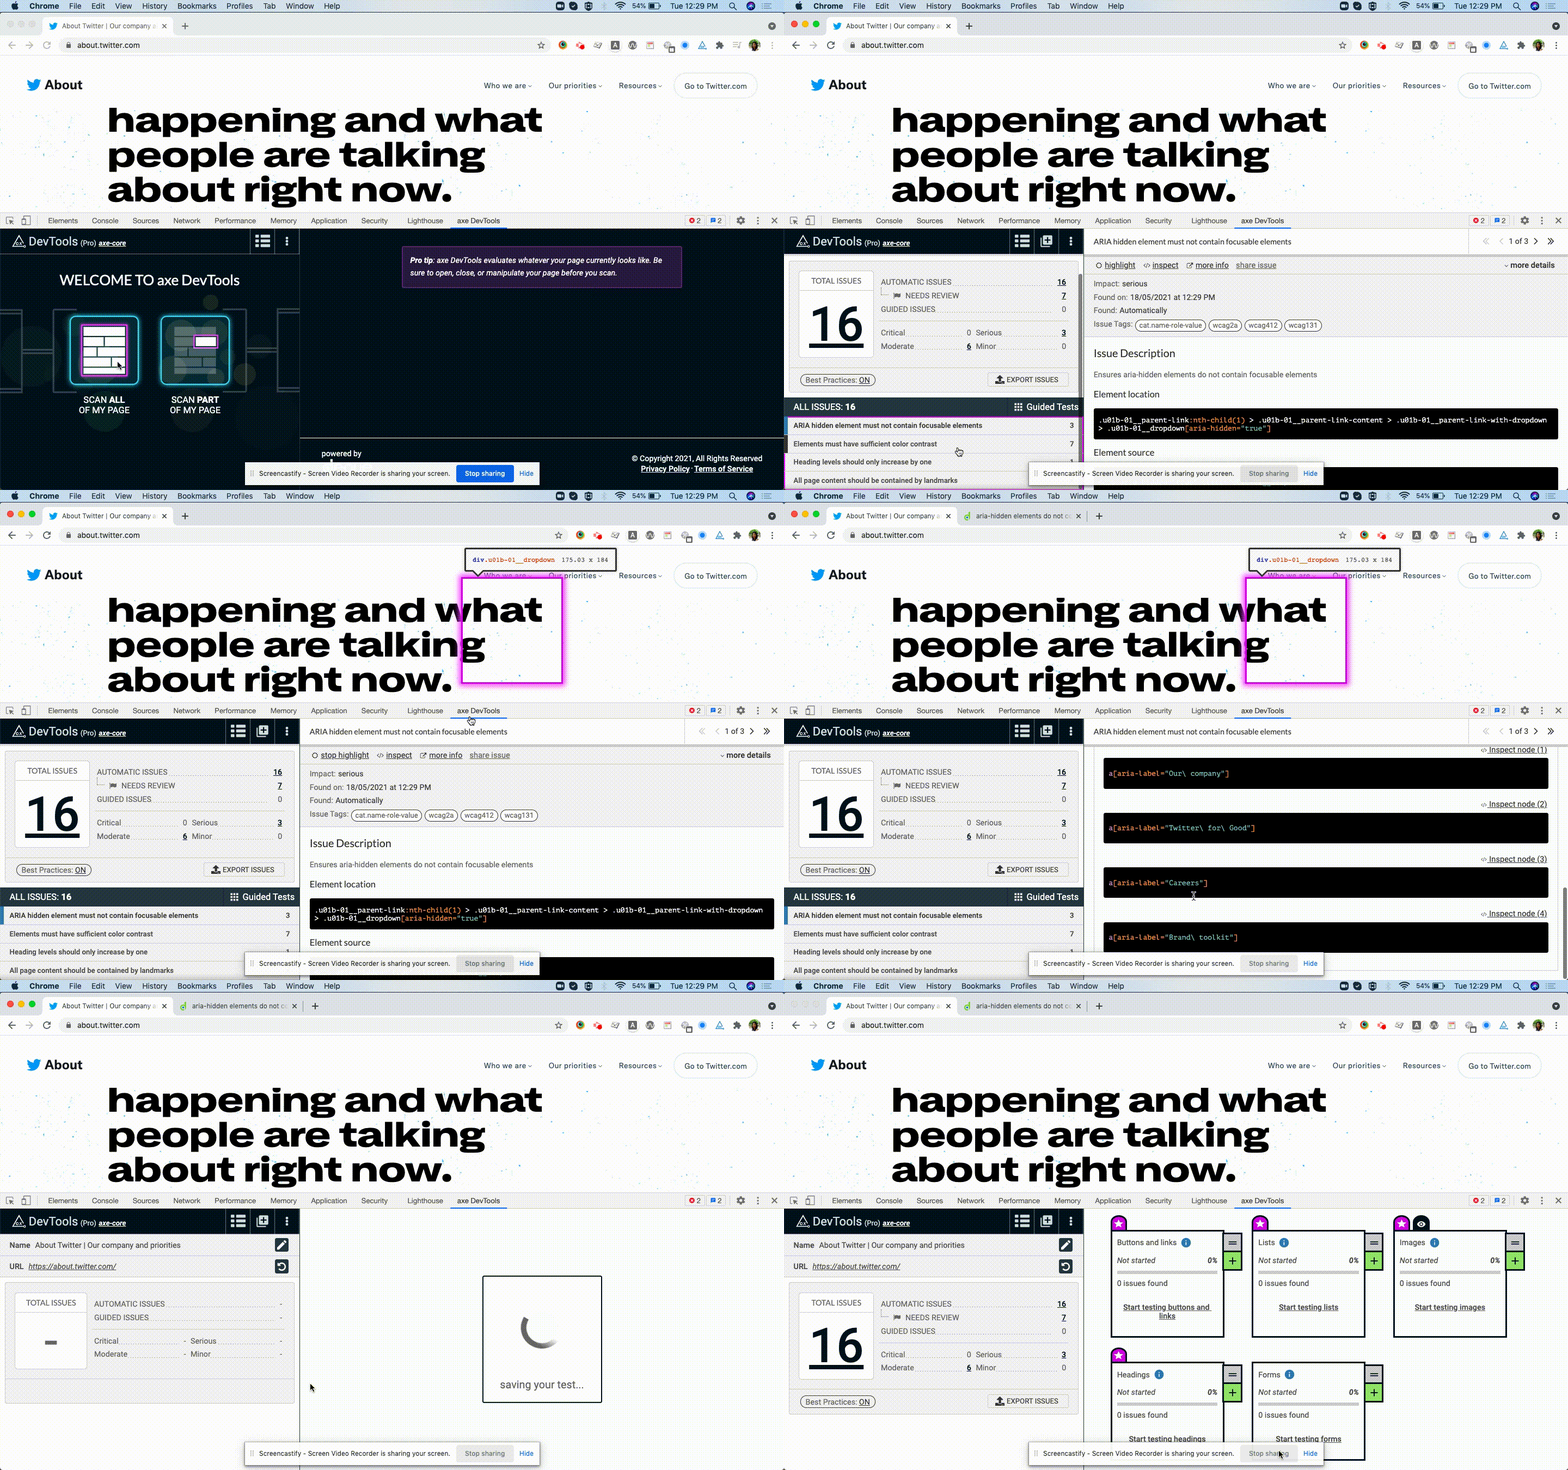
axe DevTools is an accessibility testing and audit tool maintained by deque. By using a combination of automated and guided testing, dev teams can catch up to 84% of common accessibility issues without requiring accessibility expertise. Steps to implement axe DevTools:
1. Install “axe DevTools” Chrome / Firefox extension to your respective browser
2. Open the webpage you want to audit
3. Open the browser’s developer tool and click on the “axe DevTools” tab
4. Scan the webpage and audit result will be displayed
5. The audit result contains the issue summary and a detailed description of each issue.
Now save the results
Axe DevTools provides Intelligent Guided Test functionality. These guided tests raise accessibility issues about page content and then build an issue report. This helps developers to identify issues in less time, resulting in cleaner code and a more accessible experience.
Axe DevTools helps present results in a variety of management reports:
- A dashboard view to show accessibility progress
- Using “Export Issues”, you can export reports in JSON and CSV formats (This feature is available with axe DevTools
Project reports for CI tools, such as Jenkins, Bamboo, or CircleCI can include accessibility metrics. (This feature is available with axeDevTools Enterprise plan)
B] axe - cli
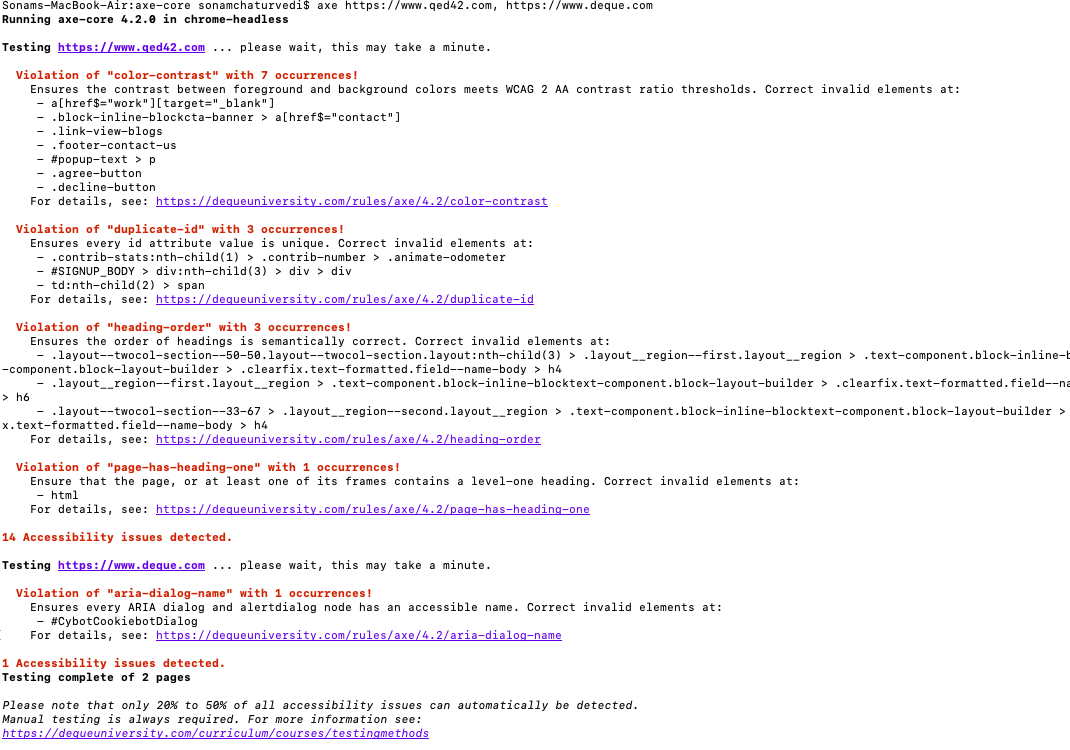
axe-cli is a command-line interface for the axe to rapidly run accessibility tests in headless chrome.
Conclusion
Accessibility testing is most effective when combined with manual testing and an accessibility audit. When you are choosing an A11y audit tool, focus on factors such as how – the tool manages multiple websites, collects accessibility issues and remediates them, how easy it is to use by both technical and non-technical team members and cost. In this way, you can use audit tools in your project and make the website more accessible.
We help build and maintain digital accessibility by embedding testing and best practices into your development process.
Happy A11y Auditing!!!

